Recruitment Funnel Metrics Every Agency Should Track
Table of Contents

Introduction
Most agencies track “applications received” and “interviews held” as if volume equals success. But these vanity metrics tell you nothing about where your process leaks revenue, why candidates ghost, or whether your screening actually predicts performance. The agencies that consistently outperform their peers treat funnel metrics as a diagnostic system—not a report card. They measure conversion efficiency at every stage, validate quality against long-term outcomes, and use the data to shift from order-takers to strategic talent advisors. This article covers the essential metrics grouped by funnel stage, how to calculate them, what good looks like, and how to implement tracking without drowning in data.
Why Agency Metrics Differ from Corporate HR
Agencies operate under unique pressures: you are accountable to both clients and candidates, your revenue depends on speed-to-fill and placement quality, and you often manage multiple concurrent requisitions with varying complexity. Your metrics must reflect dual accountability, revenue leakage points where delays directly impact billable hours, and predictive power that forecasts future performance rather than just reporting past activity. Vanity metrics like “applications received” fail on all three counts.
Stage 1: Sourcing and Attraction
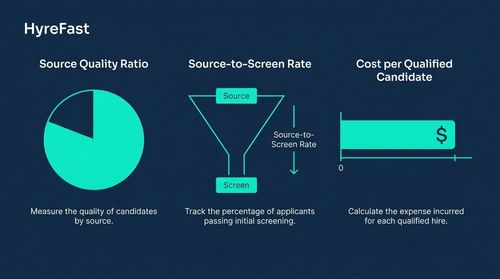
Source Quality Ratio is the percentage of hires from a source divided by total submissions from that source. It identifies which channels deliver hirable candidates, not just volume. The top 20% of sources should yield 50% or more of your hires—the Pareto principle in action. If your ratio is low for a client, audit whether you are sourcing based on their ideal candidate profile or generic templates. Top agencies co-create sourcing strategies with clients during kickoff. Source-to-Screen Rate measures the percentage of sourced candidates who pass your initial screen. A rate below 15% suggests poor job descriptions, mismatched targeting, or weak employer branding. For professional roles, aim for 25–40%. Cost per Qualified Candidate is total sourcing spend divided by the number of candidates meeting minimum competency. This directly impacts agency profitability; aim for less than 20% of your placement fee for contingency searches.
Stage 2: Screening and Assessment

Screen-to-Interview Rate is the percentage of screened candidates who advance to an interview. This is the number one predictor of recruiter efficiency. A rate below 20% means you are overscreening and rejecting good candidates; above 60% means you are underscreening and wasting interviewer time. Target 30–50% for balanced funnels. Track this metric by recruiter—top performers often screen twice as many candidates per hour with equal or better pass rates, revealing best practices in question design or rubric use. Time to Complete Screen measures the average hours from application to screen completion. Every 24-hour delay increases offer rejection risk by 7–10%. For active candidates, aim for under 24 hours; for passive talent, under 48 hours. Top agencies achieve under 12 hours using asynchronous video or AI-assisted screening. Screening Predictive Validity is the percentage of screened candidates who receive an offer. If fewer than 40% of your screened candidates get hired, your screening criteria are flawed.
Stage 3: Interviewing and Evaluation
Interview-to-Offer Ratio is the number of offers extended divided by total candidates interviewed. A ratio below 15% means you need to rescreen; above 50% suggests you may be lowering the bar. For most roles, 20–40% is healthy. Correlate this ratio with client feedback—if ratios are low but clients praise candidate quality, your interviewers may be overly stringent. Adjust rubrics or calibrate panels. Offer Acceptance Rate directly impacts placement volume and client satisfaction. An OAR below 70% requires immediate investigation into compensation mismatches or poor candidate experience. Top agencies maintain 80% or higher. Time Between Interview Stages should be under 48 hours for competitive roles; gaps beyond 72 hours dramatically increase candidate drop-off and offer declines. Use async feedback to hit under 24 hours.
Stage 4: Offer and Onboarding
Offer-to-Hire Rate is the ultimate efficiency metric—hires divided by total offers extended. For agency placements, target 75–85%. Below 70% indicates offer or communication issues. Time to Accept should be under 24 hours for top-tier candidates and under 48 hours for most roles. Long times increase counter-offer risk. Early Turnover Rate at 90 days directly impacts your reputation and replacement costs. Keep it under 10% for agency guarantees; above 15% requires a deep dive into mismatch causes—skills, culture, or expectations. Segment this metric by reason for exit to turn a lagging indicator into a predictive tool for refining sourcing and screening.
Cross-Funnel and Agency Health Metrics
Submissions per Placement measures overall funnel efficiency. Top agencies achieve 3–5 submissions per placement for contingency searches and 8–12 for retained search. Recruiter Utilization Rate—hours spent on billable activities divided by total available hours—should exceed 65%. Below 50% signals process or tech problems. Client Satisfaction Score (NPS or CSAT) is the leading indicator of retention and referral revenue. An NPS above 50 is excellent; above 70 is world-class. Cost per Placement must be less than 30% of your average placement fee to sustain margins; top quartile agencies hit 20–25%.
How to Implement Without Drowning in Data
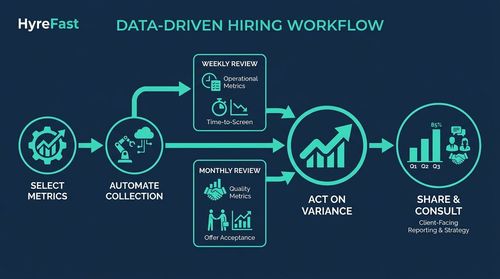
Start with three to five leading indicators—pick one metric per funnel stage that is currently broken. Automate collection using your ATS or CRM; manual tracking dies by week two. Set a weekly review cadence for operational metrics like time-to-screen and submission volume, and a monthly cadence for quality metrics like offer acceptance and early turnover. Act on variance, not absolutes: a 20% screen-to-interview rate is not bad if it is up from 10% last month and hiring manager satisfaction is rising. Share metrics transparently with clients—turn them into consulting tools. For example, “Your interview-to-offer rate is 18% against an industry average of 28%. Let’s calibrate interview panels to reduce false negatives.”
Pitfalls to Avoid
Tracking vanity metrics like applications received or interviews held does not predict outcomes. Ignoring segmentation by role type leads to misleading benchmarks—a 50% screen-to-interview rate is great for entry-level but disastrous for senior engineers. Letting metrics become goals can sacrifice quality for speed; balance efficiency with predictive validity. Not closing the loop with recruiters means you miss the chance to coach on specific behaviours like offer conversations. And using outdated benchmarks from pre-pandemic times will misguide your targets—update quarterly based on your niche and geography.
Conclusions
- The most predictive agency metrics focus on conversion efficiency (how well you move candidates between stages) and quality validation (how often screened candidates succeed later).
- Top agencies treat funnel metrics as a diagnostic system, not a report card, using them to spot bottlenecks before they cause placement failures or client churn.
- Tracking cost per placement alongside early turnover rate reveals whether speed is being bought at the expense of quality—a critical trade-off for contingency versus retained models.
- Agencies that master these metrics shift from order-takers to strategic talent advisors, commanding premium fees and longer client engagements.
Future Directions
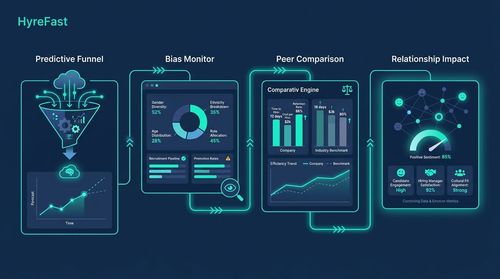
- Predictive funnel modelling using historical data to forecast placement likelihood at each stage, enabling real-time interventions like increasing sourcing from a specific channel.
- Real-time bias dashboards that monitor demographic drop-off rates at each funnel stage to spot adverse impact as it happens, not after placements are made.
- Client-specific benchmarking engines that compare your funnel metrics against anonymised peers in the same industry and role category, highlighting where you truly excel or lag.
- Experience-weighted metrics that combine traditional funnel data with candidate and client sentiment scores to weight efficiency by relationship impact—a fast placement that burns a recruiter relationship costs more long-term.